Nutrition fads come and go, but fruits and vegetables are always trendy--they’re extremely good for us, no question about it. It’s not always easy for people to get access to fresh produce, though, especially if they live in food deserts (places where fresh food is hard to find). States with a higher density of farmers markets; acceptance of food assistance programs at the aforementioned farmers markets; and other retailers (like supermarkets and corner stores) that have lots of produce are likely to have residents that eat more fruits and vegetables every day.
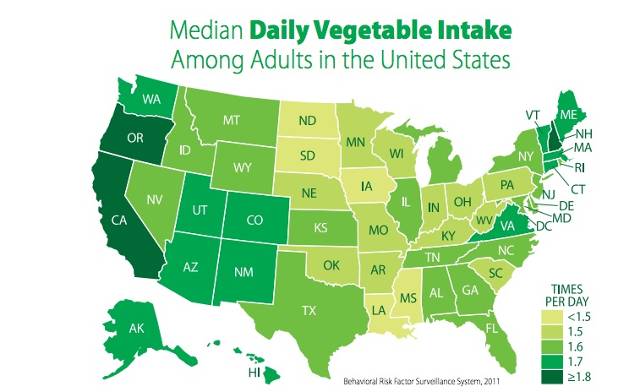
There are some obvious trends here. The West Coast generally eats the most produce every day; the East Coast eats a lot too. The Midwest and the South lag behind. The report points out that the map looks the way it does because of access to fruits and vegetables (or lack of it).
A number of states with the highest consumption of fruits and vegetables have more environmental supports.For example, adults in Oregon and California eat more vegetables than adults in other states. They also are among the highest in fruit consumption. Oregon and California are also above the national score on access to a healthier food retailer, farmers market density, and farmers market acceptance of nutrition assistance program benefits.
One thing worth mentioning: the report doesn’t define what a serving of fruit or vegetables looks like. Does the limp little tomato slice in a McDonald’s burger count as "vegetable intake"? How does that compare to a green juice packed with cucumber, carrot, and beets? That’s all presumably up for interpretation.
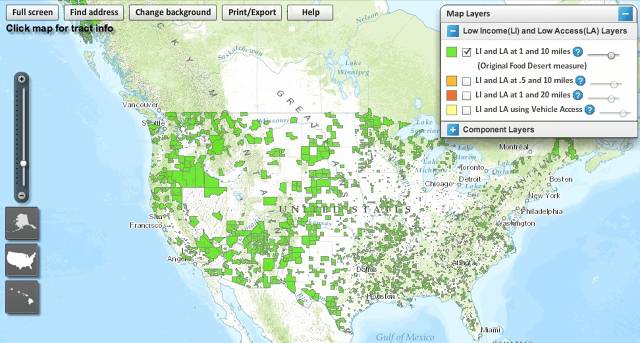
Surprisingly, this map doesn’t exactly match up to the USDA’s food desert map, which looks at low income (LI) and low access (LA) spots across the U.S, where people live at least one mile in urban locations or 10 miles in rural locations from the nearest supermarket.
It’s not just about proximity to groceries--as we mentioned, support (like farmers market acceptance of food stamps) is key
Thursday, June 13, 2013
Info graphic: How To Tell The Difference Between 66 Varieties Of Cheese
STILTON OR ROQUEFORT? THIS CHART’S GOT YOU COVERED.
With age and maturity must necessarily come more discerning tastes. Sooner or later, you’ll have to graduate from beer to wine, from Shining-Kubrick to Barry Lyndon-Kubrick, from Safran Foer to anyone else. And, of course, from cheddar to Stilton. Or Stinking Bishop. Or Garroxta. The Charted Cheese Wheel will help you make the jump from the yellow and mild commodity stuff to pungent artisanal and farmstead cheeses.
The just-released print from Pop Chart Lab indexes the vast, globe-spanning topography of cheese. The graphic collects 66 different varieties (and shades) in one very gooey, crumbly, moldy wheel.
The chart, which the designers call a “cornucopia of cheese,” is broken down according to two basic criteria: the animal of provenance and level of hardness that form a fromage’s taste and texture. A little less than three-fourths of the featured cheeses are made using cow milk, while goat and sheep together account for slightly over a quarter of the bunch. (The remaining sliver is made up of two select Buffalo cheeses.) Each type comprises four subcategories of firmness, with each example described as hard, semi-hard, semi-soft, and finally, soft.
“There was a natural cutting off point where once we went over the cheeses found in our research really represented artisanal and not widely distributed varieties,” Pop Chart Lab tells Co.Design. Still, the decision to limit the chart to the 66 and not, say, 100 cheeses sprung from aesthetic considerations: “We knew our wheel would be 18-inches in diameter with ¾-in given to each cheese to truly capture the texture and variety. We then broke it down to determine how many would fit in the overall wheel.”
The gloriously cheesy spectrum encompasses every hue of orange, yellow, and beige you can imagine. The nomenclature is equally variegated: from Pantysgawn to Humboldt Fog, Val D’aosta to Idaho Goatster, you’ll be hard-pressed to remember them all. Nothing a little testing can’t fix: as per every one of Pop Chart Lab’s projects, the designers spent much time and research doing some field testing. They tasted every one of the cheeses and dutifully took notes on their textures and flavor profiles. (They’re torn between feta and manchego.) They even rubbed shoulders with some of the cheese artisans over at Murray’s Cheese, New York’s oldest and most authoritative cheese shop. The two have struck up a month-long partnership and are raffling five $100 gift certificates, plus a free Charted Cheese Wheel print for big spenders with purchases of 100 bones or more.
So take the wheel for a spin and head to your local cheesemonger. Don’t forget the obligatory crusty baguette.
Wednesday, June 12, 2013
This Is How Much It Costs When Your Employees Smoke
Add up the cost of extra health care, smoke breaks, absenteeism, and lowered productivity, and smokers start to look like a pretty hefty business expense.
More and more companies are discriminating against smokers, either by not hiring them at all (in states where that’s allowed) or making every effort to get them to stop. It’s not particularly nice. But financially, it makes sense.
Smokers cost employers a lot of money--$5,816 a year compared to someone who has never smoked, to be exact. The number comes from new research that tallies the cost of smoke breaks (the biggest expense, at $3,077), additional health care ($2,056), absenteeism ($517), and lower productivity ($462).
Led by Micah Berman, a professor of public health at New England Law, the study reviews previous work on the economics of smoking. As it turns out, smokers aren’t always a net drag. Because they die younger, they tax pension systems for less time--meaning a $296 per year savings overall. Smokers effectively subsidize non-smokers’ retirement.
The most important question may be what companies should do about smokers. Berman recommends sympathy and understanding, while still doing everything to help along the quitting process.
“Most people who smoke started when they were kids and the vast majority of them want to quit and are struggling to do so," he says in a statement. "This is a place where business interests and public health align. In addition to cutting costs, employers can help their employees lead healthier and longer lives by eliminating tobacco from the workplace.”
We often talk colloquially about the "fast pace of city living," and that pace actually has a default speed: We’ve long assumed that people cross the street walking at about 4 feet per second.
Crosswalks are timed with this number in mind, so you don't get clipped by a creeping car when the red hand starts flashing at you midway through an intersection. But the older we get, the more likely we are to slow down. Most 80-year-olds just don’t move at 4 feet per second.
This bit of infrastructure trivia wasn't all that relevant just a few decades ago. "In the '60s, a majority of people weren't living past 70, or 75," says Hilde Waerstad, a physical therapist and research associate with the MIT AgeLab. As the vast baby boom generation now prepares to age well beyond 75, the demographics of entire cities will effectively age, too. "We're entering into this new era," Waerstad says, "that we just have not seen before."
And in most places, we're woefully unprepared. As Richard Florida reminded us last week, 10,000 baby boomers will turn 65 every day between now and 2031. By then, one in five people living in America will be older than 65. Crosswalks are only one piece of a deep-rooted problem composed of many subtle environmental details most of us never even notice: Is there a park bench to catch your breath? How about a curb cut for your walker? The pace of city living feels entirely different when you need an extra beat to read a road sign, or when you don't have a license to drive at all.
Cities everywhere need to begin recalibrating for this moment now (a better crosswalk speed, for instance, would be closer to 3 feet per second). But this generational age bomb is also arriving at precisely the worst moment to pay for those changes that will actually cost money. And then there is the problem of imagination: How do you get urban planners, transportation engineers, and anyone running around a city in their prime to picture the places where we live through the shaded eyes of an octogenarian?
"Aging happens to everybody else, it doesn’t happen to me," Waerstad says. "There seems to be this incredible denial, and I think we all share it. It's this unfathomable possibility that we will ever be the ones to give up our independence in some way because of a physical decline."
Age-proofing cities will be a cultural challenge as much as an urban design one.
"In the United States, we're a very age-denying, youth-oriented culture," says Margaret Neal, the director of the Institute on Aging at Portland State's School of Community Health. "From a social standpoint, we're way, way behind other countries in terms of how we approach our elders."
Aging Americans, Waerstad predicts, are going to experience a lot of pain before we really have infrastructure and systems in place to accommodate them, particularly in a country where we've spent decades creating communities that can only be navigated by car. And then what?
"It’s going to be this dramatic, crazy 'Oh, we need it, and we need it now!'" Waerstad says. "That's kind of human nature. We tend to wait until we absolutely need it, and then we scramble."
• • • • •
Much of the rallying cry for age-friendly communities focuses on the notion of universal design – and its related philosophy of "complete streets" – which argues that whatever is best for the least mobile of us is also best for all of us. Neal believes that you can actually see this play out if you camp out on the street and watch people approach a curb cut. Invariably, everyone uses it: "people with strollers," Neal says, "people with wheelchairs, people with their own two feet who are just too lazy to step off the curb."
The same idea applies to covered bus stops, tree-lined streets, sidewalk benches, well-lit subway entrances, and clearer road signs (type faces in the Times Roman style are easier to read than Sans Serif). But there's also a savvy logic to this argument.
"In a lot of scenarios, municipalities and people enjoy planning for children and the mothers of children more than older adults," says Michal Isaacson, an urban geographer also working in the MIT AgeLab. "So saying that 'this is good for everybody – and also for older adults' sometimes tends to make things happen more than if you’re just concentrating on older adults.”
Today, researchers at the AgeLab and the AARP also have a much stronger understanding than we ever did in the past of how the elderly get around and what they might need. The AARP conducts "walking audits" of individual streets and intersections, traveling them with crutches or walkers to document the uneven pavement or missing bus bench. The AgeLab goes one step further: Waerstad has worked to fine-tune AGNES, the Age Gain Now Empathy System suit that enables any spry 20-something to mimic the mobility, strength and vision loss of someone closer to 75.
AGNES has taken a ride on the Boston T, and driven simulated cars, and tried to shop in pharmacies. Here, AGNES goes to the grocery store:
When we do think about aging, more often we talk about what it might mean for our homes and interior spaces – for bathrooms that will need grab bars, or for two-story homes where only the ground floor becomes livable. Projects like AGNES illustrate a much larger scale of necessary interventions in the public space.
Isaacson worked on an earlier research project in Israel and Germany that used GPS devices to track older adults experiencing cognitive decline. That kind of data collection – gathering a data point every 10 seconds – can tell researchers much more than old-school travel diaries. "It’s like looking at a material with or without a microscope," Isaacson says. "We're suddenly able to see things we weren't able to see before, and ask questions we weren’t able to ask using activity diaries."
For instance, people slow down as they age. But they slow down a lot less than most of us might think, Isaacson says, with most of the decline coming among the "oldest of the old." People with cognitive decline don’t leave their homes as often as younger, healthier people. But when they do leave, they're also much less likely to venture far.
"That finding has a very strong meaning for urban planning," Isaacson says, "because it means that when you close a bank, or a supermarket, or a post office in a neighborhood, this is a population that you're affecting."
The AgeLab is currently planning another study tracking how people move through a two-mile corridor in Cambridge, between Kendall Square and Harvard Square, where researchers are currently mapping every bench, curb cut and traffic light. For the first time, they'll be able to see at a super-fine resolution why people choose to cross the street where they do, or what the timing of a traffic light really means.
• • • • •
The biggest challenge, though, won’t come from neighborhoods like Harvard Square, where a couple of curb cuts and some slower crosswalks could actually make a difference. It will come from suburban communities where there are often no sidewalks at all, let alone places to go at the other end of them.
"That's where I think still a lot of us are scratching our heads," Neal says. "Like 'what are we going to do here with these big houses a lot of baby boomers moved into?'"
Communities that are drivable but not walkable can quickly become isolated islands for those who don’t drive at all. Today, the AARP estimates that there are more than 8 million older people in America who don’t drive. By 2030, that number will likely be more than 14 million. In the United States, we largely built up suburbia to accommodate the post-war families that gave birth to the baby boomers, and later to satisfy the demand of boomers who became parents themselves and wanted even larger, private-lot homes. As this pattern proves unsustainable, baby boomers themselves will suffer the worst consequences.
"When I think about that scale, it's catastrophic. It's just simply catastrophic," Waerstad says. "If you put somebody in an urban environment and talk about that, it's still really bad."
The prospect of an aging suburbia poses a challenge to the whole way we’ve been designing communities in America, not just how we lay crosswalks and print tiny-font bus schedules. Waerstad argues that the demographics of monetary power in America will play a crucial role. More than half of the discretionary income in the United States belongs to people who are older than 50. And so the same spending might that helped create suburbia will soon be clamoring to reinvent it, to create town centers that actually have stores and doctor's offices, to turn residential neighborhoods into something more diverse, to expand transit access.
"Whenever I talk about our policy prescriptions," says Rodney Harrell, a senior policy adviser for housing with the AARP Public Policy Institute, "I say, 'we're going to help you do now what you're going to be forced to do then.' Because you're not going to be able to hide when you've got 20-plus percent of your population over 65. That's a huge portion of the population that's going to come."